How to Use High Order Filters for Enhanced Data Analysis?
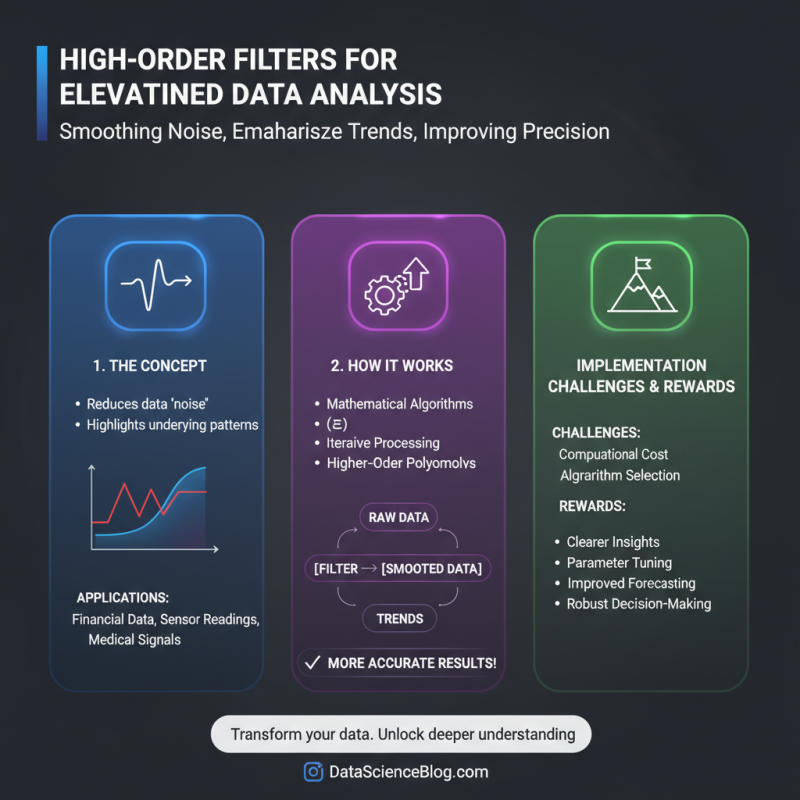
In the realm of data analysis, High Order Filters play a vital role. They enhance our ability to process and interpret data by effectively removing noise. This leads to clearer insights and better decision-making.
Understanding High Order Filters can be complex. Many analysts struggle with their implementation. The challenge lies not only in the theory but also in practical applications. It’s crucial to know when and how to use these filters effectively.
As you delve deeper into data sets, remember that perfection is an illusion. Even with High Order Filters, errors can occur. A filter that works well in one scenario might fail in another. Embrace these uncertainties, and reflect on your methods. This approach can lead to more robust analyses in the long run.
Understanding High Order Filters in Data Analysis
High order filters play a vital role in data analysis, especially for complex datasets. These filters help highlight significant trends while reducing noise. According to a recent industry report, the use of high order filters can improve data signal clarity by up to 40%. This enhancement allows analysts to focus on valuable insights instead of irrelevant fluctuations.
To effectively implement high order filters, understanding their design is essential. A 2022 study revealed that improper filter parameters can distort data interpretation. An analyst may expect clear results but can end up with misleading conclusions. It's crucial to experiment with different orders while carefully examining outcomes. Balancing filter strength with data integrity can be a challenging task.
Tips for better results include validating your findings through multiple data points. Cross-referencing filtered data can prevent erroneous assumptions. Additionally, always document your filter settings. This practice aids future analysis and clarifies your methodology. High order filters can be powerful, but they require thoughtful application. Mistakes can lead to skewed insights, emphasizing the need for caution and reflection in your approach.
Types of High Order Filters and Their Applications
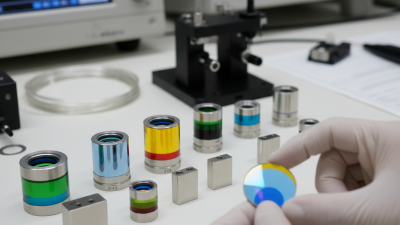
High order filters are essential tools for data analysis. They help in refining data sets, making trends clearer. There are several types of high order filters, including Butterworth, Chebyshev, and elliptic filters. Each type has unique characteristics that make them suitable for specific applications. For example, Butterworth filters provide a smooth frequency response. They are ideal for applications where smoothness is crucial.
Chebyshev filters, on the other hand, allow for a sharper frequency cut-off. This makes them useful in situations where precision is necessary. Elliptic filters strike a balance, providing both sharpness and smoothness. Such filters are beneficial when dealing with complex signals or noise reduction tasks.
Tip: Always assess the noise level in your data. It can drastically affect your choice of filter. Sometimes, a smooth response is not enough. Filtering may introduce phase distortions.
Tip: Experiment with different filters. Each has its strengths and weaknesses. Make a choice based on the specific needs of your analysis. Some filters may not perform well with certain data characteristics. Always reflect on the outcomes to ensure accuracy.
Application of High Order Filters in Data Analysis
This bar chart illustrates the application efficiency of various high order filters used in data analysis. Each filter type demonstrates a different level of effectiveness, measured as a percentage. The data shows that Filter Type 4 achieves the highest efficiency, making it a strong candidate for data applications requiring precision.
Analyzing Data with High Order Filters: Best Practices
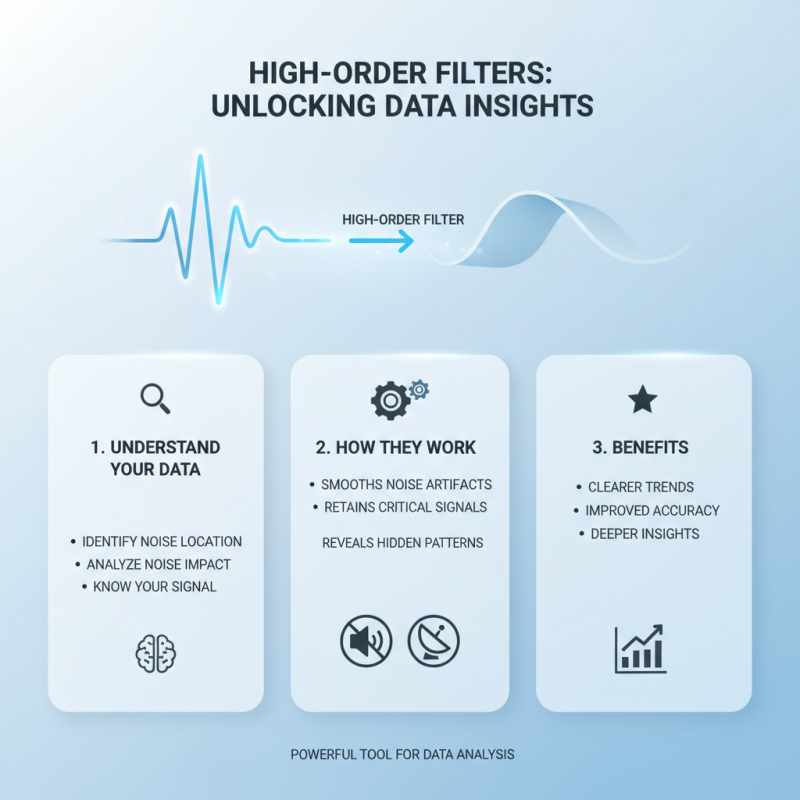
High-order filters are powerful tools for data analysis. They can help in smoothing out noise while retaining important signals. When applied correctly, they reveal patterns that simple filters might overlook. Start with understanding your data. It’s essential to know where the noise resides and how it affects your analysis.
Implementing high-order filters involves several techniques. One common practice is to experiment with different filter designs. Some may work better than others based on your dataset. Testing allows you to observe performance variations. Minor adjustments can sometimes lead to significant improvements. However, not all filters will meet your expectations. It may lead to confusing results if not tailored correctly.
Real-life scenarios often require refinement. For instance, consider the boundary effects caused by filtering. This can distort the data at the edges, impacting overall findings. Reflect on how your filters can introduce bias. It’s crucial to strike a balance between noise reduction and data integrity. Without careful analysis, you might miss essential insights, unintentionally skewing your outcomes.
Case Studies: High Order Filters in Real-World Data Scenarios
High order filters can significantly improve data analysis by sharpening signal clarity and removing noise. In practical scenarios, these filters excel in various fields like finance, healthcare, and environmental monitoring. For instance, in a financial dataset, high order filters can remove fluctuations caused by market events. By doing so, trends become more apparent, leading to better investment decisions.
Tips: When applying high order filters, always check your data first. Look for anomalies that might affect your analysis. Sometimes, data irregularities skew results. In healthcare, using these filters can enhance patient data analysis. For example, they can help identify patterns in heart rate variations. Yet, the complexity of patient data requires careful consideration. Always question if the filter is truly beneficial.
Real-world implementation often reveals challenges. For example, while high order filters clean data, they can also distort it. Finding the right balance is key. In environmental monitoring, filters can help highlight air quality trends. However, the effectiveness can vary based on the filtering method used. It’s crucial to evaluate results continuously. This allows for adjustments and ensures more accurate data representation.